During these Kafkaesque times, we know that we are travelling less. Google, Apple, and many other location-based studies have shown a dramatic reduction in daily movements across our towns and cities. As the COVID-19 transmission rate got under 1, and the grim figures seem to return to average levels, these restrictions began to ease, allowing many, not essential business, to resume activities, with the caveat of generating new infection hot spots through the country. And that happens.
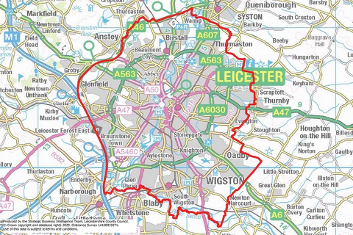
In June 29th, 2020, the government announced a local lockdown in Leicester following a surge in COVID-19 cases [1]. The areas affected are delimited by the boundary shown in Figure 1. These restrictions put Leicester back into a limited mobility scenario, where only the key workers are allowed to go to work. Areas with less key workers tend to have fewer people commuting, but, where are these areas? In this brief post, we want to show where Leicester’s key workers concentrate and investigate their spatial relation with regions with high COVID-19 cases. Also, we like to emphasise that a lockdown scenario not only reduces flows but does change, in general, the commuter patterns.
Key workers
The UK government Published on 19 March 2020 the “Critical workers who can access schools or educational settings” guide [2], where it outlines who is entitled, during a hard lockdown, to bring their kids to school. As part of an extensive note, in our group at the CASA, UCL, we established a baseline for Key (K) and Non-Key (Nk) workers by exploring commuting flow data from the 2011 UK census and merging this with the above guide. We reached our E estimates by linking government guidance documents that define key occupations with the ONS Standard Occupational Classification 2010 (SOC) [3]
All our K/Nk figures are aggregated at Middle-Super Output Area (MSOA) level, that are geographic hierarchies designed to improve the reporting of small area statistics in England and Wales (Scotland equivalence is something called Intermediate Zone).
Leicester Key workers
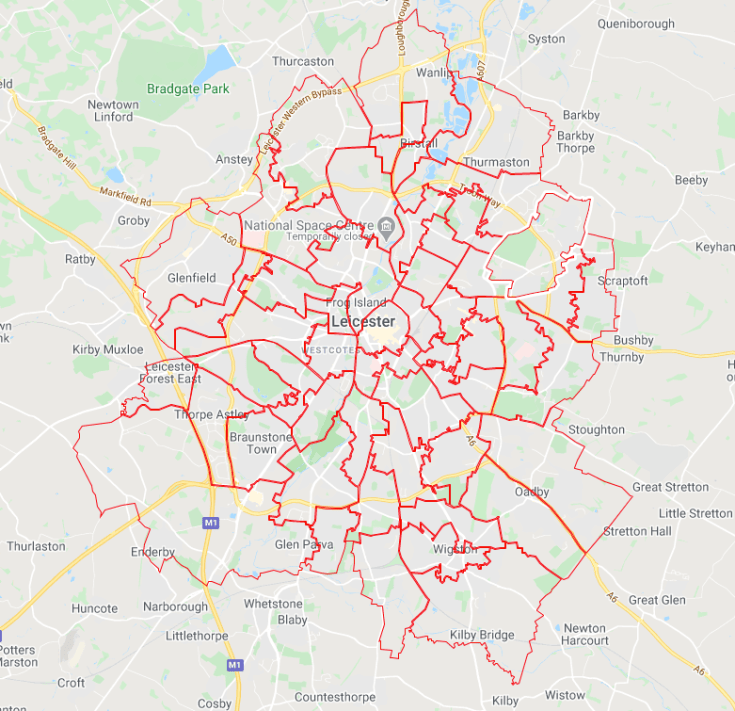
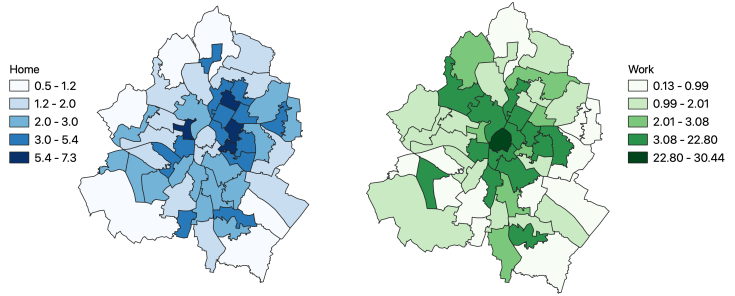
Our first task was to map the lockdown polygon supplied by the government into MSOA (Figure 2, top panel). In this area (51 MSOAs), the working population (16-65 yrs) was ~7,490 people in 2018, which is above the England and Wales average of 6,660 across 6,791 MSOAs. This “excess” in potential workers is reflected in a slightly high number of commuter trips from key workers into and from the lockdown area, compared with the rest of the country. The 2011 Census reports ~145,000 trips by road, bus and rail, with K workers’ trips accounting for 26% of those. So yes, high streets are deserted, but there are still areas with a good share of movement between them.
Key workers travel most to the Leicester central area (Figure 2, lower panel) from Leicester West region. The home densities are in general low per MSOA and concentrate mainly in four areas: Highfields, Spinney Hills, Newfoundpool and Belgrave. And it is precisely in three of these four, where we observed an increase in the incident of COVID-19 cases in the last weeks.
Leicester COVID-19 cases
COVID-19 cases by week at MSOA level can be obtained at [4]. Figure 3 shows where the bulk of cases from weeks 19 to 28 are located.
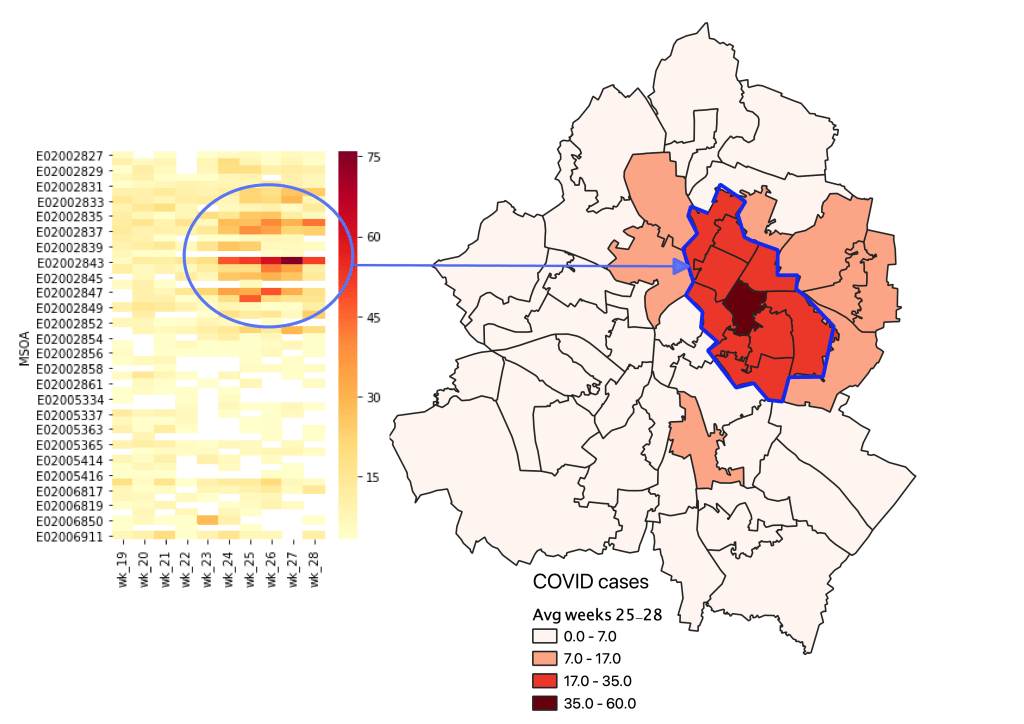
There is a clear overlapping between MSOAs with high key workers density and areas with high COVID cases. In this brief post, more than doing some fancy spatial correlation analysis, I want to show that, even with the local lockdown, there is an important number of people commuting to and from these profoundly affected areas.
Commute from Leicester COVID-19 hotspots
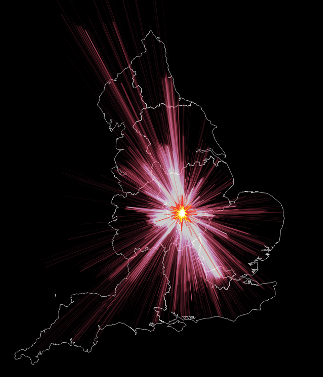
To get a feeling on the patterns Leicester’s key commuters define, first let us look at Figure 4, showing all the flows (K/Nk) registered in 2011. As expected, the vast majority of these flows are between MSOAs around Leicester, like Birmingham and Nottingham, but also London and even Scotland and Welsh regions.
There were almost 270,000 commute trips at this area in 2011, with K workers accounting for 14% of those. In the ten MSOAs corresponding to the high COVID incidents, this percentage drops to 3.5% (~9,000 trips)
Commuters from the hotspot area travel mostly locally. However, as Figure 5 (left panel) shows, numerous key workers are travelling outside Leicester, even as far as London, Leeds and Manchester. Trips from these areas (Fig. 5 right upper) have Leicester centre as their preferred destination, but there are also significant flows to Glebelands, south of Thurmaston and from Spinney Hills! On of the highest COVID cases area in the last weeks. We need to further investigate the precise occupations commuting to this area to figure out why these high numbers.
Now, trips to the high COVID areas (Fig. 5, right lower) are mostly into three zones: Goodwood (where the Leicester general hospital is located); North Evington and Belgrave (where we can found the Belgrave Health Centre ). Are these key workers hospital workers? It could be the case, as health practitioners and nurses are a prominent group commuting to these zones.
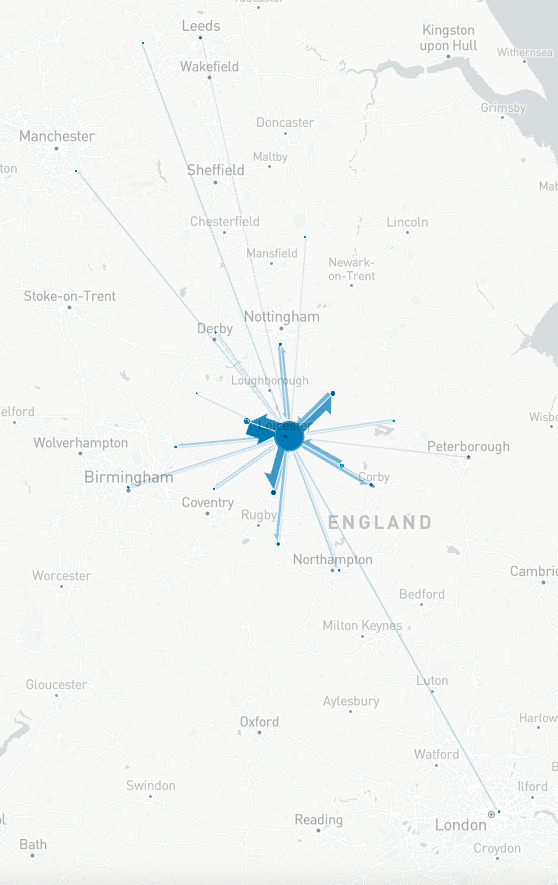
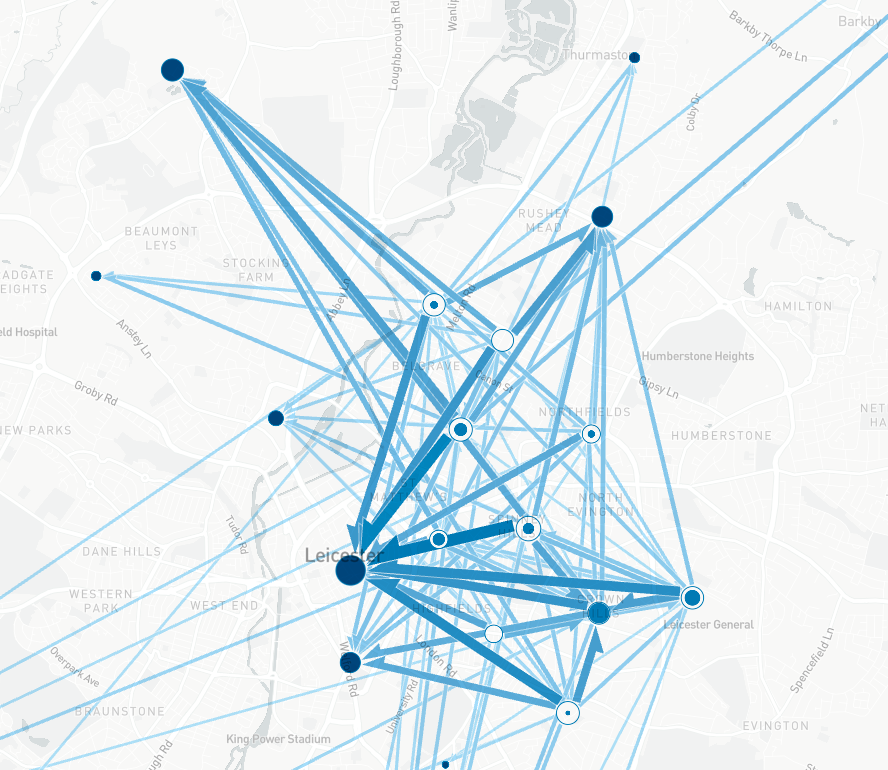
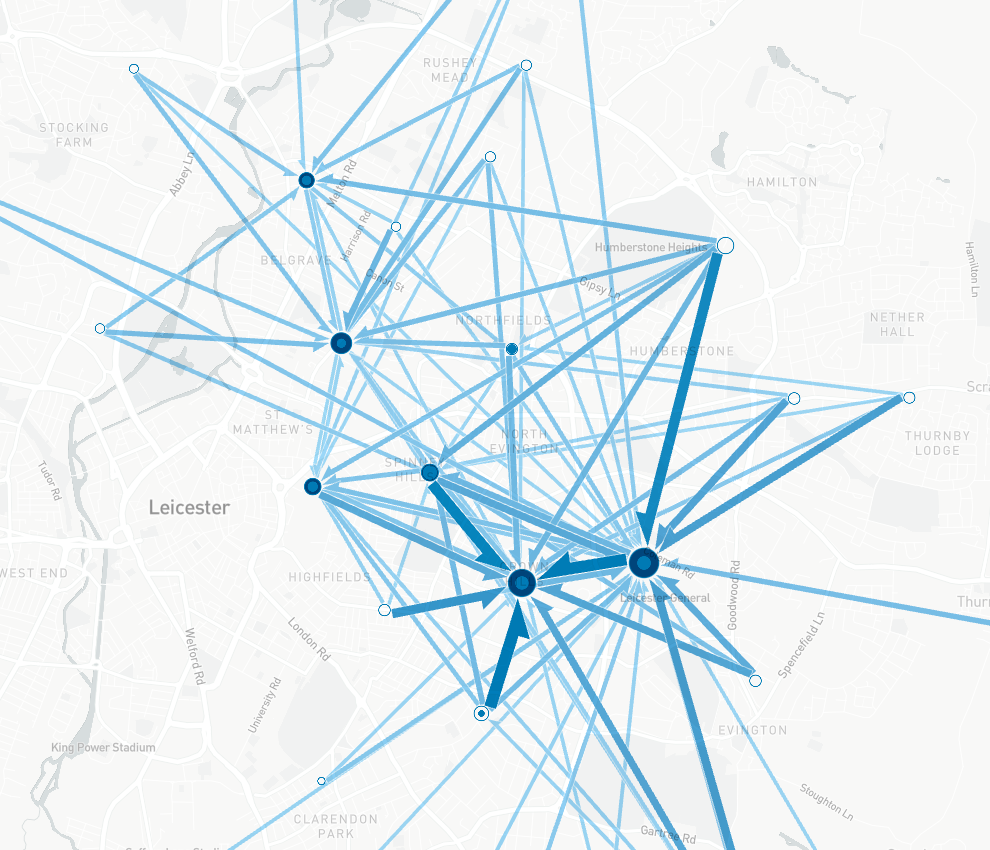
Figure 5. Left panel, all trips into and from the COVID-19 hotspot areas. Right panel up, trips from and right panel down, trips into the most affected regions by the virus. The images were done using the fantastic https://flowmap.blue/ tool.
So what?
The complexity of local lockdowns is such that key workers could be at risk of being the ones spreading the virus, as they live or work in high-risk areas. Not free lunches here. To maintain some type of working society, we need key workers in the first instance. There is plenty of variables in play that affect the rate of transmission and the raise of new hotpots, so being aware where our key workers are going is fundamental to protect them.
As more local lockdowns are in the horizon (https://www.bbc.co.uk/news/uk-england-lancashire-53400376), we need to relate precisely who is moving where, and, if we link this data with a spatial interaction model, we can further investigate how people would rethink where to live and work.
References
[1] Leicestershire coronavirus lockdown: areas and changes. https://www.gov.uk/government/news/leicestershire-coronavirus-lockdown-areas-and-changes
[2] Critical workers who can access schools or educational settings https://www.gov.uk/government/publications/coronavirus-covid-19-maintaining-educational-provision/guidance-for-schools-colleges-and-local-authorities-on-maintaining-educational-provision#vulnerable-children-and-young-people
[3] Standard Occupational Classification 2010 https://www.ons.gov.uk/methodology/classificationsandstandards/standardoccupationalclassificationsoc/soc2010
[4] Coronavirus (COVID-19) https://coronavirus-staging.data.gov.uk/cases

Leave a comment